G1-G3
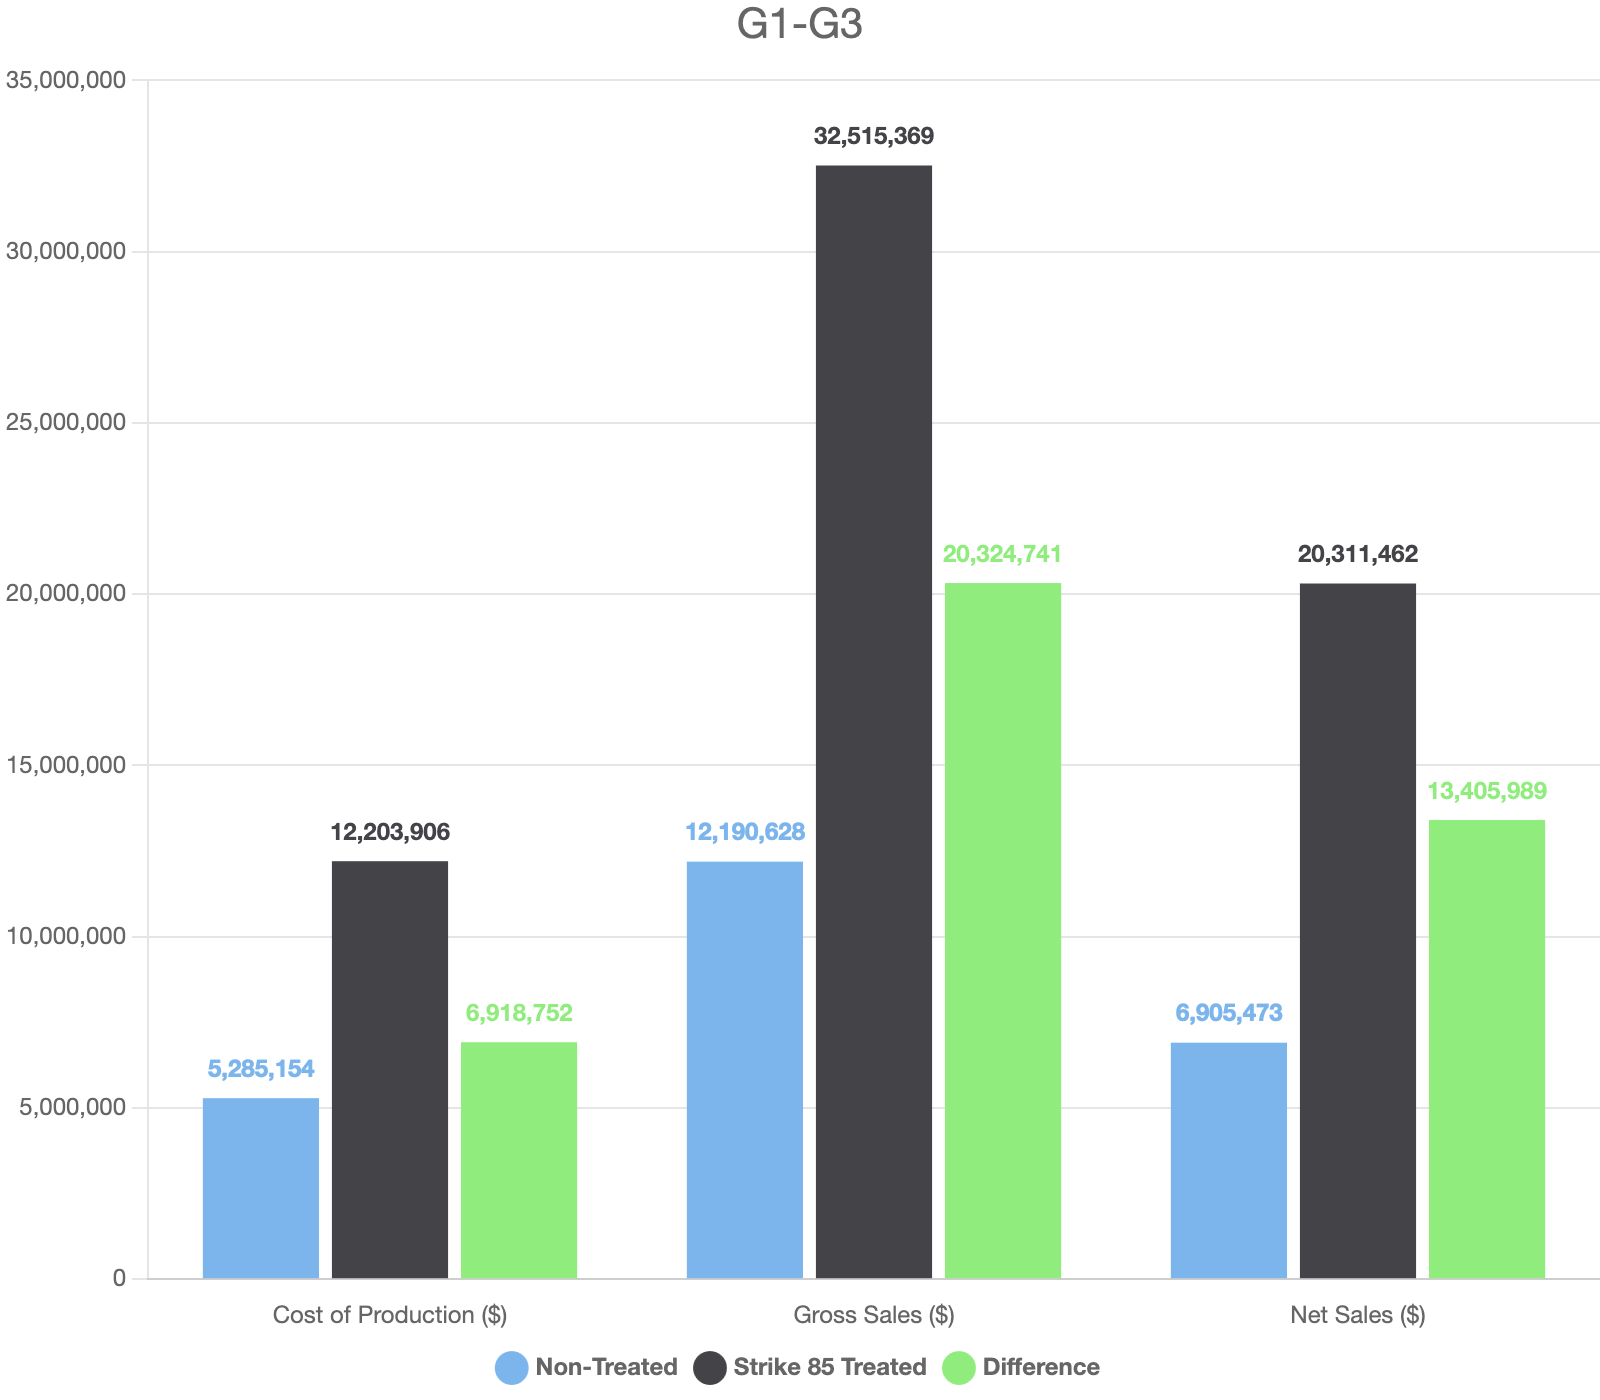
G1-G3 G1-G3 Column chart. Data table with 4 rows and 4 columns follows. G1-G3 Cost of Production ($) Gross Sales ($) Net Sales ($) Non-Treated 5,285,154 12,190,628 6,905,473 Strike 85 Treated 12,203,906 32,515,369 20,311,462 Difference 6,918,752 20,324,741 13,405,989